
VISNJAN, August, 2000
Report from the
Supernova-Search Group
Jelena Perić (1), Gregor Kervina (2) and Giovanni Sostero (3)
(1): Opća Gimnazija Fran Galović, Koprivnica (Croatia)
(2): Srednja pomorska šola, Portorož (Slovenia)
(3): Osservatorio Astronomico di Remanzacco, Remanzacco (Italy)
Sažetak: Za vrijeme VSA 2000 naša grupa je tražila supernove. Koristili smo dvije različite strategije lova na supernove i u ovom izvještaju detaljno smo ih opisali ,a uz to dali smo i nekoliko korisnih adresa za slične programe promatranja koji će možda biti provedeni u budućim Višnjanskim školama astronomije. Najzanimljiviji rezultat našeg posla bila su fotometrijska mjerenja već otkrivene supernove. Ti podaci omogućili su nam da izračunamo približnu udaljenost galaksije u kojoj se supernova dogodila,a koja do sad nije bila dobro poznata.
Introduction:
A supernova is the final glorious burst phase of a dying star. Summarising these phenomenon in few essential words, there are at least two types of
supernovae: Type I and Type II, originated by different astrophysical mechanisms. Type I supernovae, with no Hidrogen lines in their spectra, are originated from a white dwarf star accreting matter from a nearby companion,
through Roche-lobe overflow. When the white dwarf exceeds the limit of 1.44 solar masses, it will eventually produce a thermonuclear detonation. Type II SNe, with clear Hidrogen marks in their spectra, are originated by the core
collapse of a single, very massive star. SNe type I are likely to occour on almost every galaxy type (spirals, ellipticals, etc.), while SNe type II occour only in early types, like spirals, with preference for the rich star
forming regions of these. Each type of SNe has also at least two important subclasses (type Ia and Ib, and type II linear and type II plateau). These distinction are mainly based on their photometrical properties. The aim of
our group at the current year Višnjan School of Astronomy (VSA 2000)
was to experience how a scientific research program is planned, conducted and concluded. There were two main subjects of research: i) a SN-Search observing program, and ii) the photometric study of an already discovered SN, in order to determine experimentally its lightcurve. In the following sections we will present the results of our work.
Used Instrumentation and Comments During our work we had encountered a number of different problems, but most of them were successfully solved. For example, we changed our observing strategy in the course of the school, in order to increase our
possibilty of finding a new supernova. In several images, we found some (possible) moving objects and we spent a lot of time trying to identify them.We thought they might be asteroids, but later we found out that they were
simply spurious camera defects.To avoid the "real" moving objects (i.e. asteroids), that could be sometime wrongly identified as possible SNe, we didn't take anymore images of galaxies situated in the ecliptic.There was a lot of
problems with hot pixels and the background noise because every SN candidate we found turned out to be just a camera artifact.At the begining we tried to use script files for setting the telescope in position, but later we decided
to operate the telescope manually because we had to decide on the moment if we have to make a new image or not, which depended on the brightness of the galaxy and on the image quality.We also met some problems with pointing the
telescope, so we were forced to image galaxies that were on the S-E part of the sky.In spite of everything we took a lot of images. The weather was serving us nicely in the last part of VSA 2000, while in the first days we had some
troubles with it.
During our work we used a rich set of hardware and software:
Visnjan Obs. 0.4m, f/4.3 Newton
+ AP8 CCD was the opto-electronic image acquisition system. The output of this instrumental complex is a .FITS format CCD image, spanning almost 1x1 square degree, with a pixel-scale factor equal to 2.7arcsec/px. The CCD camera itself has a 1024x1024 pixels array, each pixel being 24 micrometer square. The typical limiting magnitude with a 120 second of exposure time (cooling @+12C) in a clear and transparent night was usually around 19. In order to increase the S/N ratio of our frames, we composed (added) mos
t of the times two to four images in a final one. An autoguiding system, based on a 200mm f/10 Schmidt-Cassegrain telescope + SBIG ST6 CCd camera was used. The telescope was set to the target
galaxies by the Gandalf (T.M.) software, developed by M.Jurić. The image processing was performed using QuickMips 32bit software. For our photometry of SN fields, we never
applied any filtering nor unsharping process. Some ancillary software was used as well, like Guide-6 for finding the targeted star fields, Simbad database
for extracting data about galaxies and cluster of galaxies, POSS (Palomar Observatory Sky Survey) has provided the galaxies reference images. The big usefulness of Internet was exploited surfing frequently the "Bright SNe" Homepage for last minute information on already discovered SNe, and constant reading of IAU Circulars for announcements of new discoveries.
Data reduction procedure
The image processing was restricted to the absolutely necessary steps: first we imported the images from the database, then we opened them on our PC, and saved them in a format compatible with the image processing software. Then we opened the images with Quick MiPS 32 Ver.1,8, and adjusted their contrast and brightness. Normally we recorded with telescope a few images (tipically two to four), in order to compose them together. So in the program we composed all the single images of the same field in the final one. With this step we increasesed the total exposure time, and so the limiting magnitude on our final image. After this we cheked if there were any new objects in the galaxies. We compared our pictures with the reference ones that we took from the atlas, or from internet archive. If a sospect object was found, then we made additional pictures of the same galaxy in the following nights, in order to discriminate a possible newly discovered SN from noise effects or artifacts of our CCD camera and, if the pictured star field was in the Ecliptic area, from an asteroid passing by on the galaxy star field.
Obtained Results and Their Discussion
Part 1) Output of the SN-Search observing program These SN-search observig program was very exciting, because we got some suspect candidates in a few galaxies we pictured,
but unfortunately all of them were lately recognized to be CCD artifacts or background noise originated by cosmic rays. We also realized that such search is very time consuming: while a single image required only 3
minutes to be acquired, later it needed almost 30 minutes to be processed and completely analized. In this way we were unable to process all the 30 to 50 star fields we usually we recorded on each clear night. So another strategy
should be considered in order to speed up the image processing and analysis. For example, the professional SN-search programs usually operate in a completely automatic way, also for the identification of any possible SN in their
plates. From a statistical point of view, we consider that in the first two days our efficiency at the telescope (number of images per hour) was rather low, because we had yet to make experience with the telescope, the software,
and so on. Since the third night on, we were able to collect a total number of images close to 50 (in 3 hours of oberving time), providing an average rate of almost 16 images per hour. The professional automated SN-search are able
to record 50 to 70 images per hour. So we would expect that our rate of discovery would be almost four times smaller of that of a professional SN-search as the LOSS. Usually the LOSS cooperation is discovering three to five SNe
each month. If our searching program has continued for other three or four weeks, we have a chance for discovering our own SN. So it is not surprising that on a total number of only three complete and good observing nights, the
total number of SN discovered by us is equal to zero. TABLE 1: our efficiency at the telescope Our efficiency recording images can be seen through this table:
night No. of images Time at the telescope
1. 13 few time due to schedule problems
2. 7 few time due to bad weather
3. 30 2h50min
4. 49 3h15min
5. 18 1h57min
6. 29 1h 50min
----------------------------------------------------------------
----------------------------------------------------------------
TABLE 2: target objects: List of the main Galaxies and Galaxies Clusters recorded:
To this list another 150 fainth background galaxies should be added List of the supernovae recorded: SN2000cw, SN2000cx, SN2000cz, SN2000E
Considerations for a future SN-Search Program During the VSA2000, we have experienced two different
SN-Search strategies, for a future possible SN-search extended programme to be conducted: the first two nights we recorded nearby bright galaxies, that mainly occoured in a number of one or two for each of our CCD frames. In
these way, we were likely to discover some possible SN in its ascending phase to maximum, given that such galaxies are rather bright, and then frequently checked for SNe by many amateurs. Our only chance to be the first to discover
a SN there was then relying on our deep limiting magnitude and, in this way, being faster than our "competitors". Later on we experienced a completely different strategy by taking images of HCG and ABELL clusters of faint
galaxies. In this way we had two main advantages: we cut-off most of the amateur SN-searchers because of the fainter magnitude of these objects, and we had many more galaxies recorded on each single frame (tipically 5 to 20 of
them). On the other hand, we have also to consider that for such faint and distant galaxies, a SN was likely to be detectable with our instrumentation for only a week or two, while for the nearby galaxies we are likely to follow a
SN for one or two months.
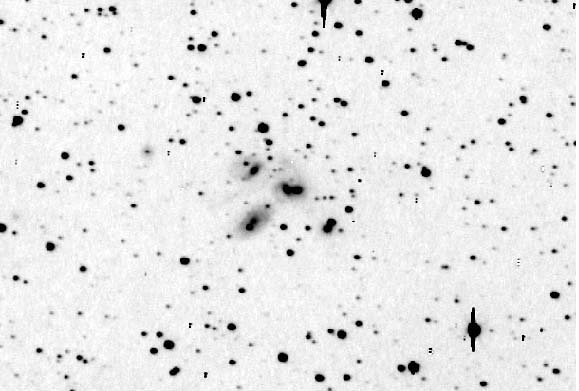
FIGURE 1 The compact group of galaxies HCG 92, also known as "Stephan's Quintet", where pictured by us on July 31, 2000. This is a good example of a small cluster of galaxies. Toatl exposure time of 4 minutes.
These two different searching methods have clearly their own advantages and disadvantages, and a careful choice among them should be considered, before
a serious SN-search program would be established at the Višnjan Observatory or at an another observatory with similar technical capabilities. The mainly distinction among these two possible strategies would be very likely
driven by the average number of usable nights per month. If a check of the targeted star fields is possible at least twice a month, than the "cluster of galaxies" strategy would be an attractive choice. Otherwise the
shots at a single galaxy would have the same chance of discovery rate of the "sigle bright galaxy" method. Considering the promising meteorological conditions of a site like Višnjan, we would like to suggest the adoption of the
first Sn-search program: the "cluster of galaxies" way. Part 2) An application: SN2000cw lighturve study We were particulary interested on SN2000cw because of its particular scientifc interest. We
imaged it on four different nights. After taking images of this object, and the subsequent data reduction procedure, we estimated its magnitude in two different ways: by a visual estimation, and through an analytical method.
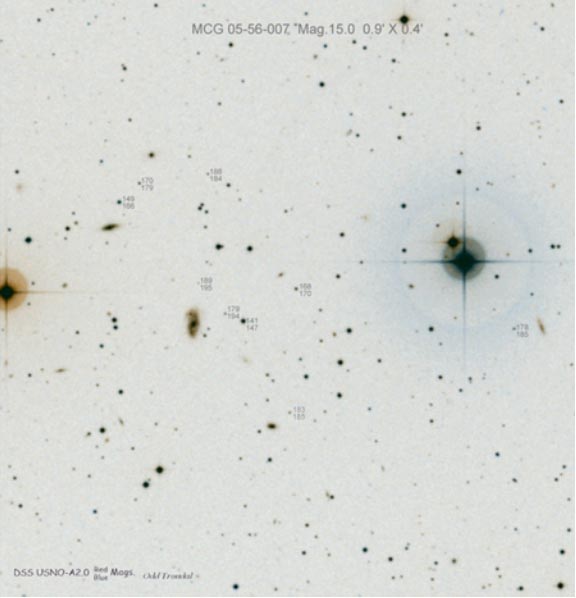
FIGURE 2 The R and B photometric sequence nearby MCW+5-56-007
Visual estimation: the method and its accuracy In the field of the SN we choosed two stars with known magnitudes, taken from the calibrated list provided by O.Trondal through the Net. One was fainter and one was brighter than the
SN. We calculated the interval between their magnitudes and we devided it in ten parts. In our case the fainter star had magnitude 17.9 and the brighter star had magnitude 16.8. So the interval between them was 1.1 magnitudes. We
estimated the supernova brightness with reference to those two stars looking at their images on the PC monitor, and simply detrending its appropriate final magnitude. In order to decrease the measuring error, we averaged
among them every single estimation each of us has taken. The estimated magnitude accuracy on the reference stars seuqnece provided by O.Trondal is close to 0.1magn, while the estimated accuracy of our visual estimation on the
SN is close to 0.2 magn. Analytical method: procedure and accuracy First we measured through a small window, the intensity (number of total counts) of the supernova, the fainter and the
brighter reference stars on their three brightest pixels, and we average these values. Then we measured the intensity of the sky background in four points around each object, and with the simple Pogson formula, we calculated the
difference in magnitudes between the SN and brighter star and between the SNs and the fainter star. For the brighter star: For the fainter star:
where: int.SN: number of counts for the Supernova int.SN bg: number of counts for the Supernova Sky Background int.BS: : number of counts for the Bright comparison Star
int.BS bg: number of counts for the Bright comparison Star Sky Background int. FS: number of counts for the Fainth comparison Star
int.FS bg: number of counts for the Fainth comparison Star Sky Background In that way we got two different magnitudes values, one for each reference star used. Then we calculated the average value of them, and that
was the result of the analytical method. The associated error bars of this method is estimated to be around +/- 0.2 magnitudes as well, and is mainly produced by the difficulty to substract the backgroud noise nearby the SN: all
around it, we had the fainth spiral arms of the hosting galaxy, that could not be easily substracted from the SN itself. For the final magnitude calculation, we averaged the results obtained from the visual and the
analitical methods. The final magnitude accuracy is estimated to be close to +/- 0.2 magnitudes.
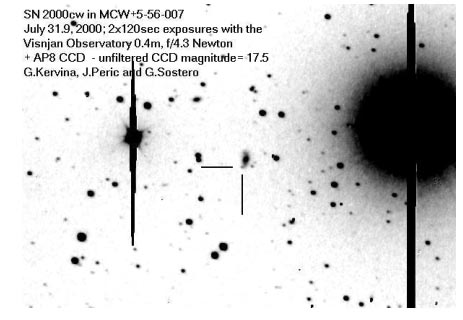
FIGURE 3 Typical example of our CCD images of SN2000cw
Calculating the distance of the galaxy MCG+05-56-007 by means of SN2000cw On July 14 of the current year, the LOSS (Lick Observatory Supernova Seach) collaboration has discovered a SN in the galaxy MCG +5-56-007. Its announcemet was given
through the IAU Circular Nr. 7456 on July 16, 2000. The hosting galaxy is a barred spiral with B=15.1, and an apparent size of 0.9x0.4 arcmin. Its distance was not known with accuracy, and the only catalogued data we took from
SIMBAD database give a recession velocity of V=9034 Km/sec, and a Z=0.030134, that place it at almost 184MPc (600 MLy) from us. The SN was located at R.A. = 23h47m25.1s and Decl.= +28d 23' 16", i.e. 8.4
arcsec E and 21.2 arcsec S of the nucleus of the hosting galaxy. At the moment of discovery it was estimated to be at an unfiltered CCD magnitude close to 17.5, while one day later it has rised to magnitude 17.2 The spectroscopic
data obtained on July 17 at the Calar Alto Observatory (Spain), had shown that it was a Type Ia SN, catched within a few days around maximum light. We have taken the opportunity of using part of the telescope
time of our SN-Search program to study its lightcurve, and try to obtain from these data an estimation of the distance of the hosting galaxy. It is well known from the literature that SN Type Ia are good markers of cosmological
distances, because they are likely to always reach at maximum light the same absolute magnitude of V= -18.5. So, being able to establish from the experimental data, the apparent magnitude, it's a simple exercise to derive the given
distance of the SN, and then that of the hosting galaxy. The apparent maximum magnitude of an exploding SN type Ia is given by the formula:
m(app) = DM + (A) - 18.5 (1)
where: m(app): apparent magnitude DM: distance modulus A: absorpion (in magn.) along the line of sight
The Distance Modulus is obtaind simply by substracting the apparent and absolute magnitude of the SN While its apparent distance would be:
D = 10 Exp [ (DM / 5) - 5] (2)
where: D: distance (in MPc) DM: distance modulus According the lightcurve we obtained putting together our data and the data taken from the Net, SN2000cw has
likely reached maxim light around July 18, at magnitude 17.0. All the magnitudes available up to now were provided by unfiltered CCD's, so we could assume that they are near the R band. At these early phases, a SN type Ia has an
average V-R close to 0.3, so the equivalent V magnitude at maximum light was very likely near V=17.3 We don't know what's the Absorption in the direction of the SN, so what we can provide is just the upper limit for its distance.
Would new data about this parameter be available, it would also be possible to scale the calculated distance to a more precise value. Deriving DM from (1), we obtain a value for the Distance Modulus of 35.8,
that inserted in (2) will provide a distance of SN2000cw (and thus of MCG+05-56-007) of 150 MPc, (i.e. almost 490 millions light years), to be compared with the previously poorly accurate catalogued value of almost 184MPc (or 600
MLy). This, as already considered before, should be assumed as the upper limit
of its distance. But provides anyway a useful information on the host galaxy and then, with a larger set of data, on Cosmology, because of its implications to the Hubble's Costant determination, and the expanding model of the Universe.
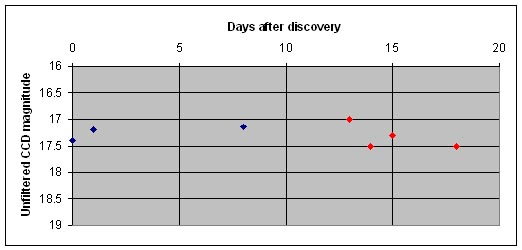
FIGURE 4 Unfiltered CCD lightcurve of SN2000cw
blue dots: data taken from
literature, red dots: our data
Part 3) Ancillary results: contribution to the media Among all the galaxies we recorded, there were also some already discovered SN. Our pictures of three of them (SN2000cw, SN2000cz and SN2000E) were of good quality, and were published
on the homepage of D.Bishop "Bright Supernova", that is the reference homepage for amateurs and professionals interested on SNe. For SN2000cz we were able to get images minutes after the announcement of its discovery by the IAU
Circulars, and our image was the first to appare on that homepage, apart (for sure) from the discovery image. Our picture of this SN has also been published on the homepage of the English magazine "The Astronomer".
We were asked by the Višnjan Observatory (V.O.) directorate, also to take same images of bright galaxies (M31, M33, NGC6946, NGC891, etc.) not for SN-Search purposes, but to provide the V.O. images database with some more nice
images to be used for its homepage.
Conclusions
During the VSA 2000 our group has conducted a SN-Search program. We have experienced two different strategies of SN hunting, and in this paper we describe them in details, giving some useful addresses if any similar observing program would be established in future VSA's. The most interesting scientific output of our work, was the photometric measurements of an already discovered Supernova. This data, has allowed us to calculate, within the given uncertainties, the distance to the host galaxy, that was previously much poorly known.
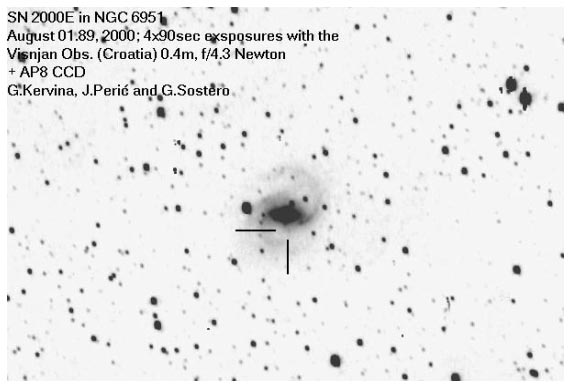
FIGURE 5 One of our images published on the Net: the fainth (magnitude 19) SN2000E caught at the limit of this 6 minutes total exposure CCD image.
Acknowledgements
We would like to thanks the ICSC-World Laboratory for the support and Višnjan Observatory staff, and in particular K. Korlević and M. Jurić, for their kind hospitality and for the continous support their gave us in the conduction of our observing program.
We would also like to thanks the other groups of the VSA2000, for their helpful collaboration of the telescope time allocation.
References
Barbon, R., Ciatti, F., and Rosino, L. (1979) Astron. Astrophys. 72, 287
Bartel, N. (ed.). (1985). 'Supernovae as Distance Indicators', Berlin: Springer-Verlag, Lectures Notes in Physics, No.224 D. Bishop 'Bright Supernova',
Filipenko, A. V. and Sargent, W. L. W. (1985). Astrophys.J. 286, 644 Wheeler, J. C. and Harkness, R. P. (1986). In Proceedings of the NATO
Advanced Studies Workshop on Distances to Galaxies and Deviations from the Hubble Flow, ed. B. F. Madore and R. B. Tully, in press
HOME
PROGRAM LECTURES PROJECTS EXCURSION TRICK AND TIPS APPLICATION FORM
VARIOUS